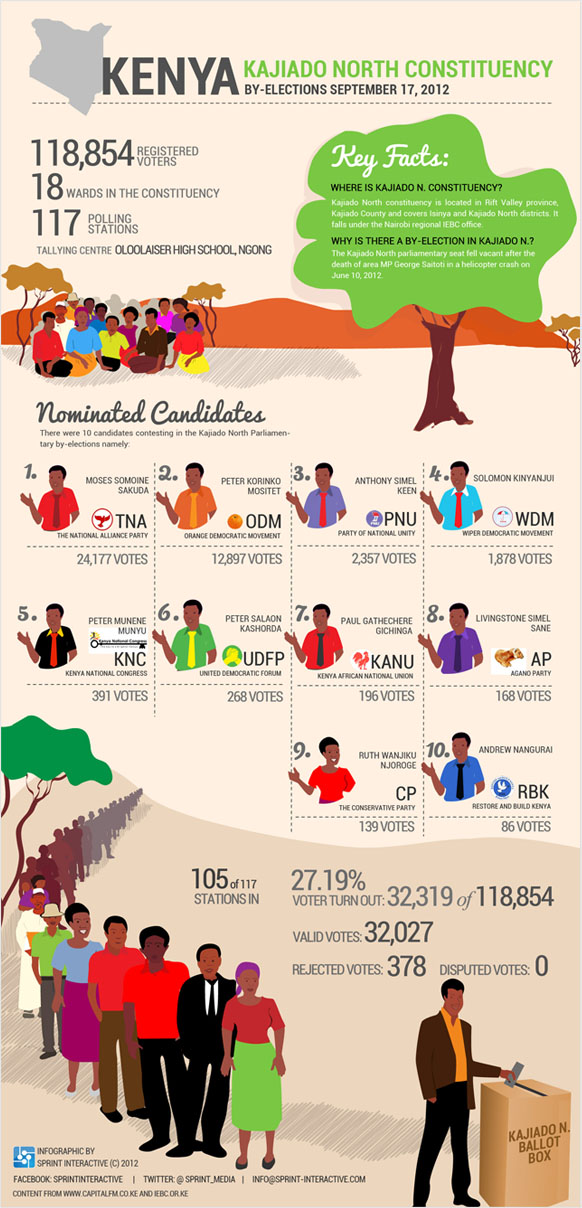
Gathering data
Sifting through data is where it all begins. It arrives raw and messy: an excel spreadsheet, some PDFs and links to other resources are typical. While there is sometimes guidance--"We'd like to compare the charts on pages 12 and 65"--we take this as a clue to find the story being told. This is also when we begin to gather additional research from new sources. The full picture of a story is usually found scattered through multiple materials, not in isolated charts alone.
Finding the STORY
What starts as boring data will become a boring infographic unless a great story can be found. Infographics start with a unique intent. It might be clarifying a complex set of data, explaining a process, highlighting a trend, or supporting some kind of argument. Finding a great narrative is the first hurdle.
Design Frames
As a story emerges from the data at hand, it's time to stop for a reality check. In many cases, the data doesn't support the story a client wants to tell. What follows is usually a slightly awkward discussion. Sometimes a client will want the designer to use only the facts that make them look good, twist the data, or otherwise get around this snag.
Design Process
Once the data has been combed, the most interesting facts selected, and a hierarchy determined, a wireframe is created. Here, we build an understandable visual representation of the important information and its hierarchy to send to the client for review. This is not the ultimate design but a tool for discussion, enabling agreement on the structure the final piece will take.
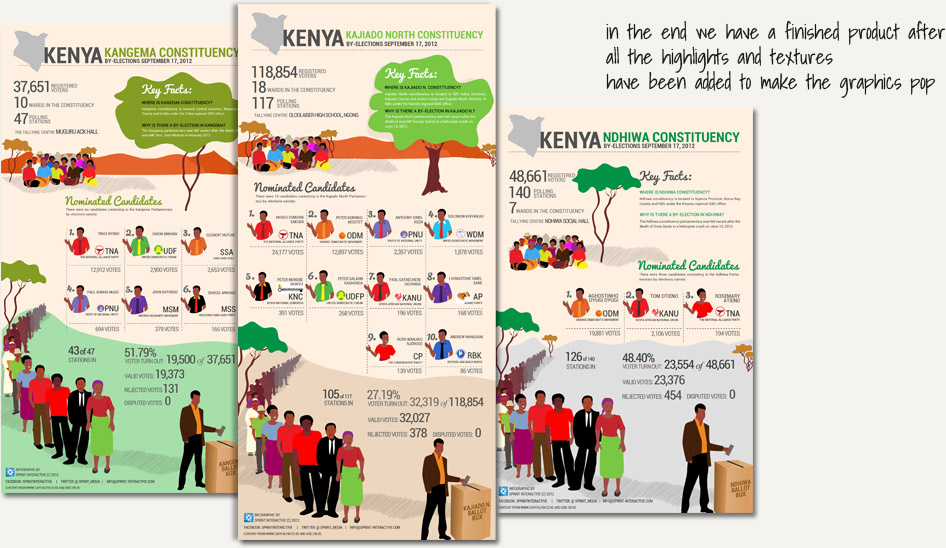
Continue the refining process through sketching and iterations, and gain feedback from as many people as possible. You should begin to see the finished product coming into shape.
Finalise