creating understanding through visuals
power of info-visualisation
Knowledge: Through visualisation the report gains more meaning and brings more knowledge.
clarity: Information becomes transparent and relevant and considerations are easily made.
appeal: Data becomes more important, it tells a story and communicates to the user in a new way.
speed: Communication is instant and comprehension on different information types is faster.
interest: Visual communication is more accurate, catchy and has more impact on the users.
Our Visualisation Services
WE TELL STORIES FROM DATA
If pictures are worth a thousand words, consider an infographic a novel. Through data visualization we can simplify complex data and abstract ideas into visuals that are fun to look at and easy to understand.
Our modern societies are buzzing with the constant creation of new data, although it often fails to provide the right tools to understand it.
This is why we believe in designing advanced visualization solutions, bridging the widening gap between abstract data and the needs of the public. We want to bring clarity out of data and provide new ways of approaching complex figures.
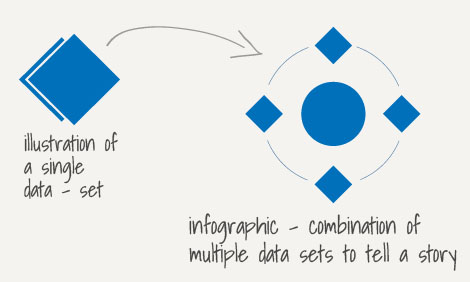
Infographics
Using multiple data visualizations in service to a theme or story.
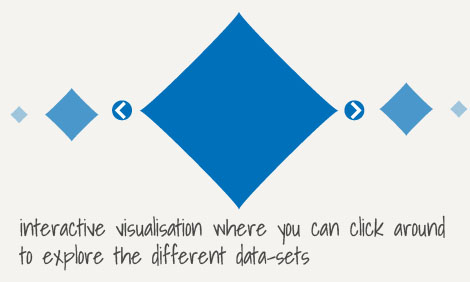
Interactive Visualization
Any visualization where you can dynamically filter or explore the data.
Data Journalism
A combination of text and visualizations in a journalistic format.
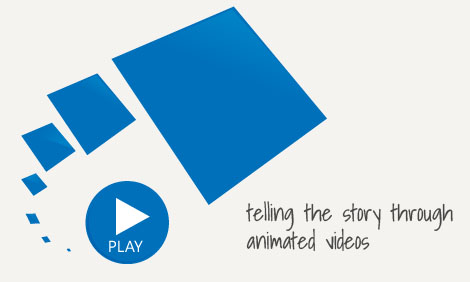
Motion Infographic
Moving and animated visualizations along a theme or story.